The Ultimate GMI to A1C Chart: Making Sense of Your Glucose Numbers
It happens to almost everyone. You are sitting there looking at your continuous glucose monitor app, the numbers are flashing on the screen, and you feel completely lost because they look nothing like the lab slip your doctor handed you last Tuesday. The confusion is exhausting. Patients and caregivers just want a reliable gmi to a1c chart to stop the mental math and figure out what is actually happening inside their bodies.
Having dependable medical equipment is only half the battle; knowing how to read the data it spits out is what actually keeps you safe. When your wearable device fires off hundreds of readings a day, the sheer volume of information can cause massive anxiety. If you do not know how those daily spikes and dips translate to your overall health, you might start heavily restricting your diet out of fear or wildly adjusting insulin doses. Clear facts stop that panic.
The fix is learning to translate your daily phone notifications into the long-term clinical language your doctor uses. We are going to break down the exact differences between these measurements and give you the tools to predict your next lab result.
Why Your Numbers Clash (And Why You Are Not Crazy)
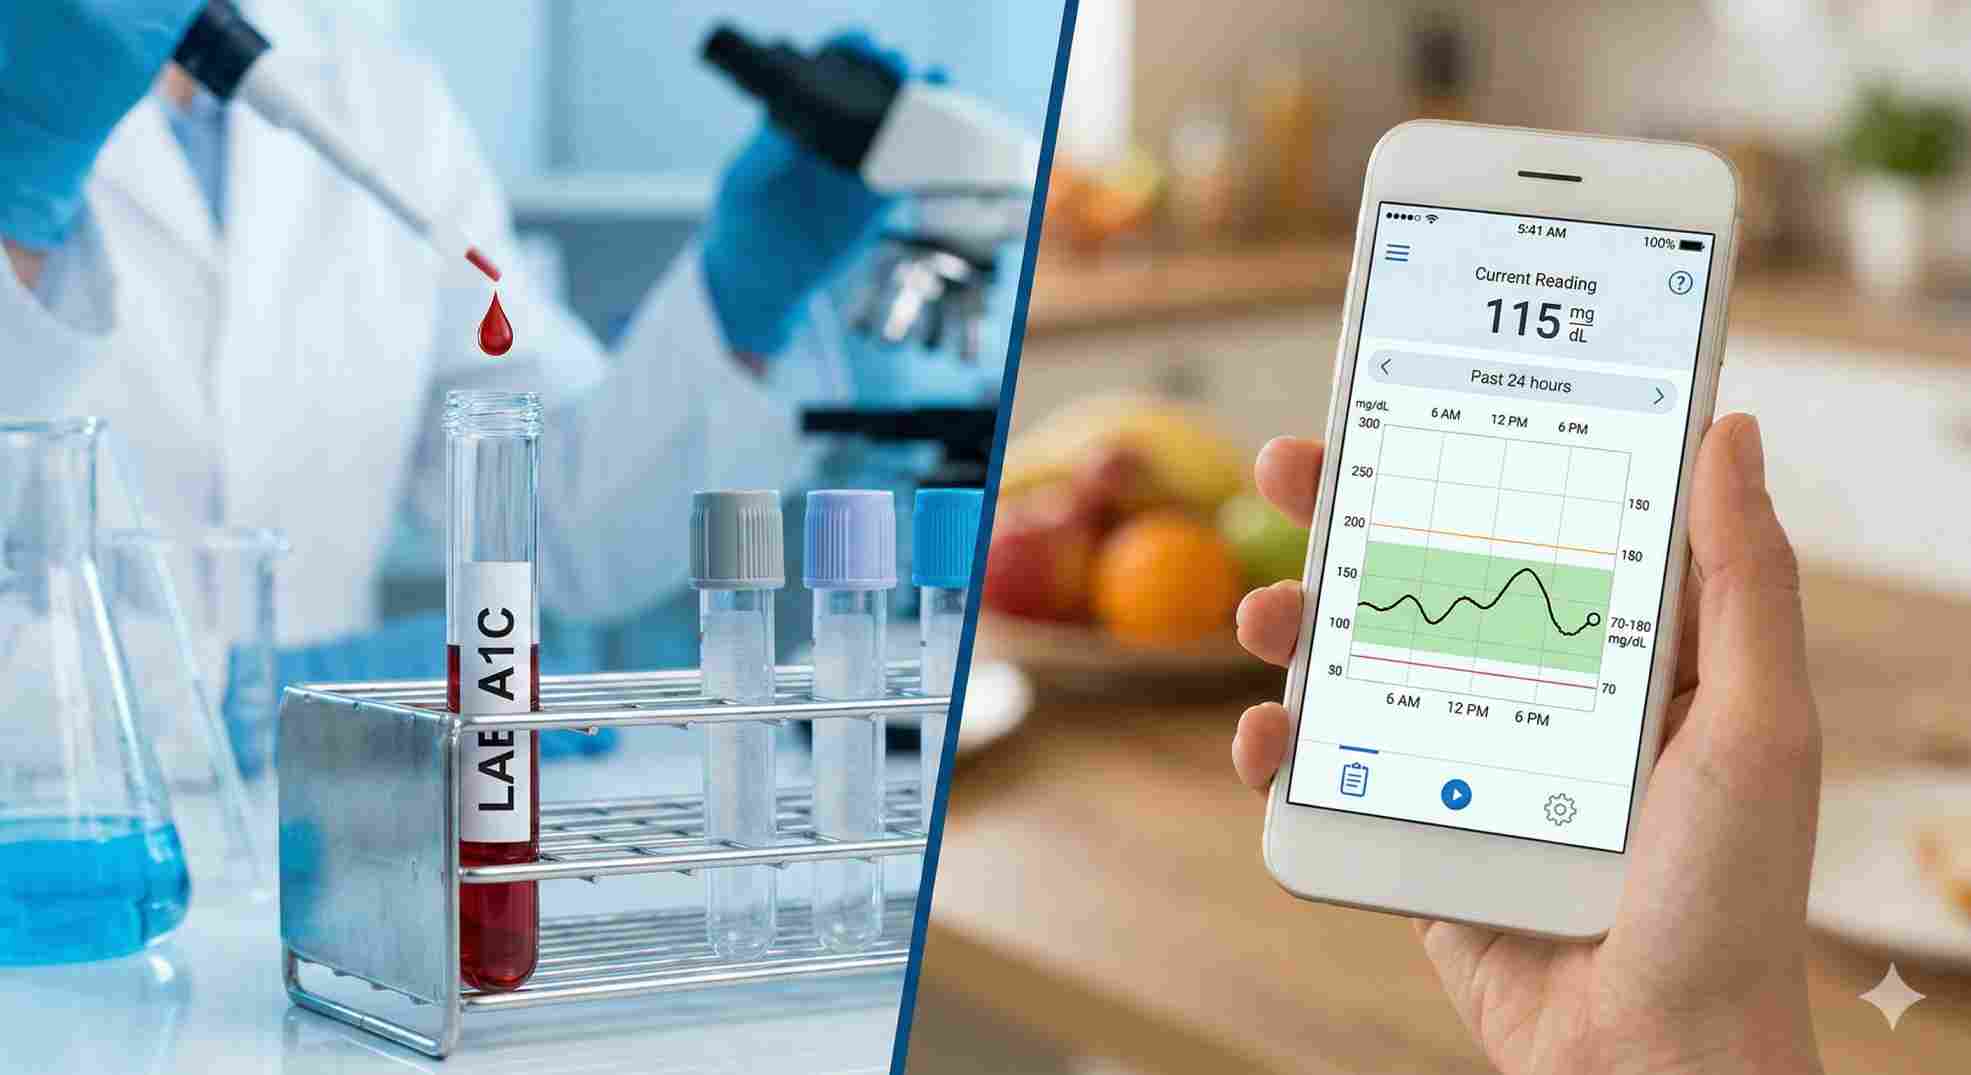
Here is the reality check most doctors forget to mention in the rushed 15-minute appointment: GMI and A1C are measuring two entirely different things. Your A1C is a physical measurement. It literally counts how much sugar has stuck to your red blood cells over the past 90 days. Your GMI (Glucose Management Indicator) is just math. As detailed in published clinical research from the National Institutes of Health, it takes the sensor readings from the fluid under your skin over the last 14 to 30 days and calculates an average.
If your GMI says 7.0% but your lab A1C comes back at 7.5%, your machine is not broken. You did not do anything wrong. Your blood just behaves slightly differently in a laboratory test tube than a computer algorithm predicts on a screen.
 What Exactly Does a GMI to A1C Chart Tell You?
Think of a gmi to a1c chart as your personal translation guide. For decades, endocrinologists and organizations like the American Diabetes Association relied entirely on the A1C blood test to judge your diabetes management. That was the gold standard. The problem? A single test every three months hides massive daily struggles. You could suffer through terrifying low blood sugars and massive, exhausting highs, but if they averaged out to a 7.0%, your doctor would pat you on the back and send you home.
Continuous glucose monitors changed that. They give us the Glucose Management Indicator. This specific metric tells you what your A1C should be, based strictly on the continuous stream of data from your arm or stomach.
- A1C: Looks backward 3 months. Shows physical sugar attachment to cells.
- GMI: Looks backward 14-30 days. Shows calculated averages from sensor fluid.
If you need a broader look at how your daily numbers convert into long-term averages beyond just your CGM data, you should also explore our complete pillar guide, A1C Calculator: Let’s Make Sense of Your Numbers, to get the full picture of your metabolic health.
Using a gmi diabetes chart gives you a crystal-clear roadmap. If your GMI has been running higher than you want for the last three weeks, you have plenty of time to tweak your routine before your official lab draw. You are never flying blind.
The Complete Conversion Data
Below is the standard reference guide to translate your daily average glucose readings into the expected GMI. Keep this handy. Share it with your caregiver.
Table 1: Standard GMI to Estimated Average Glucose
| Estimated Average Glucose (mg/dL) | Expected GMI (%) | Expected Lab A1C Equivalent (%) |
|---|---|---|
| 100 | 5.4 | ~ 5.4 |
| 115 | 5.7 | ~ 5.7 |
| 126 | 6.0 | ~ 6.0 |
| 140 | 6.4 | ~ 6.4 |
| 154 | 6.8 | ~ 6.8 |
| 168 | 7.2 | ~ 7.2 |
| 182 | 7.6 | ~ 7.6 |
| 197 | 8.0 | ~ 8.0 |
| 211 | 8.4 | ~ 8.4 |
| 226 | 8.8 | ~ 8.8 |
Note: Your personal biology matters here. If your red blood cells live longer than average, or if you have an iron deficiency, your actual lab A1C will shift away from the expected GMI. That is completely normal.
 Pairing Your GMI to A1C Chart With the Right Equipment
To get a gmi to a1c chart reading you can actually trust, your equipment has to work flawlessly. Anyone who has dealt with Durable Medical Equipment (DME) suppliers knows it can be a massive headache. You are managing prescriptions, chasing insurance approvals, dealing with shipping delays, and hoping the device actually sticks to your skin for the full 10 to 14 days.
Not all monitors work the same way. Some make you manually swipe your phone over the sensor to get a reading. Newer models push the data straight to your device—and your caregiver’s device—automatically.
Table 2: Top CGM Equipment Feature Comparison
| CGM Brand Model | Data Transmission | Warm-up Time | Wear Duration | Best For… |
|---|---|---|---|---|
| Dexcom G7 | Automatic (Bluetooth) | 30 minutes | 10 days | Fast warm-up and extreme accuracy needs. |
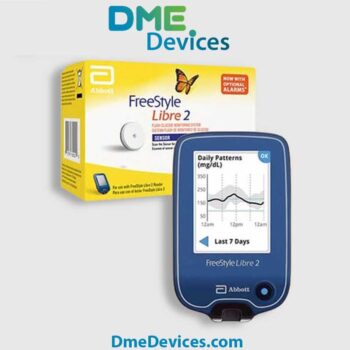
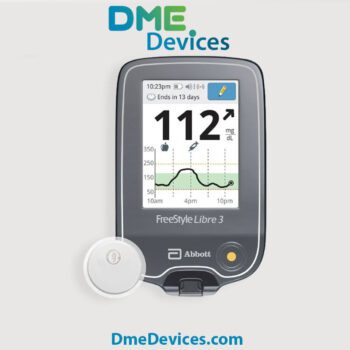
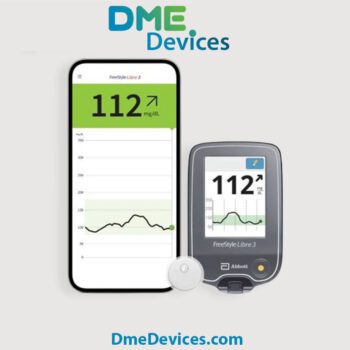
| FreeStyle Libre 3 | Automatic (Bluetooth) | 60 minutes | 14 days | People wanting the smallest, most discreet sensor. |
| Medtronic Guardian 4 | Automatic (to pump) | 2 hours | 7 days | Patients actively using Medtronic insulin pumps. |
Equipment choice is step one. If your sensor constantly loses Bluetooth connection or gives you weird “compression lows” because you rolled over on it in your sleep, your gmi to a1c numbers will be garbage. Always apply sensors to clean, dry skin. Skip the moisturizing lotions on application day. Use heavy-duty medical over-patches if you sweat a lot at work.
 Tired of Painful, Blind Guesswork?
Pricking your fingers multiple times a day is exhausting. It hurts, your fingertips get heavily callused, and the worst part? A standard finger test only tells you your blood sugar for that exact second in time. It completely misses the massive sugar spike from an hour ago or the dangerous drop happening right now while you sleep. You are making critical health and insulin decisions based on huge blind spots.
You do not have to bleed to know your numbers anymore. Imagine glancing at your smartphone and instantly seeing your glucose data stream directly to your screen in real-time. A tiny, painless sensor on your arm can do all the heavy lifting, giving you the continuous data you desperately need to track your gmi to a1c chart accurately.
Take the painful guesswork out of your daily routine. Switch to modern CGM technology today and get your health back on track.
Insurance, Medicare, and Paying for Supplies
Getting the medical equipment you desperately need shouldn’t drain your bank account. Knowing exactly how insurance companies and Medicare process these supplies saves you serious money. It requires patience, but fighting through the red tape pays off.
Medicare recently loosened their rules for CGMs. You do not have to be taking multiple daily insulin injections to qualify anymore. But do not let your guard down—the paperwork your doctor submits still has to be flawless. One missing checkmark means a denied claim.
Table 3: Medicare & Insurance Coverage Hurdles
| Insurance Type | The Good Stuff | The Frustrations |
|---|---|---|
| Traditional Medicare | Covers 80% of costs if medical criteria are met. | Demands strict chart notes from the doctor every 6 months. |
| Medicare Advantage | Can offer lower co-pays for DME supplies upfront. | Sometimes forces you to use painfully slow suppliers. |
| Private Insurance | Usually approves the newest tech much faster. | High deductibles mean high out-of-pocket costs in January. |
If you are a caregiver ordering for an aging parent, ask the DME supplier point-blank if they handle the prior authorizations. The good ones will contact the doctor directly, pull the clinical notes, and send the massive paperwork packet to Medicare for you. Let them do the administrative heavy lifting.
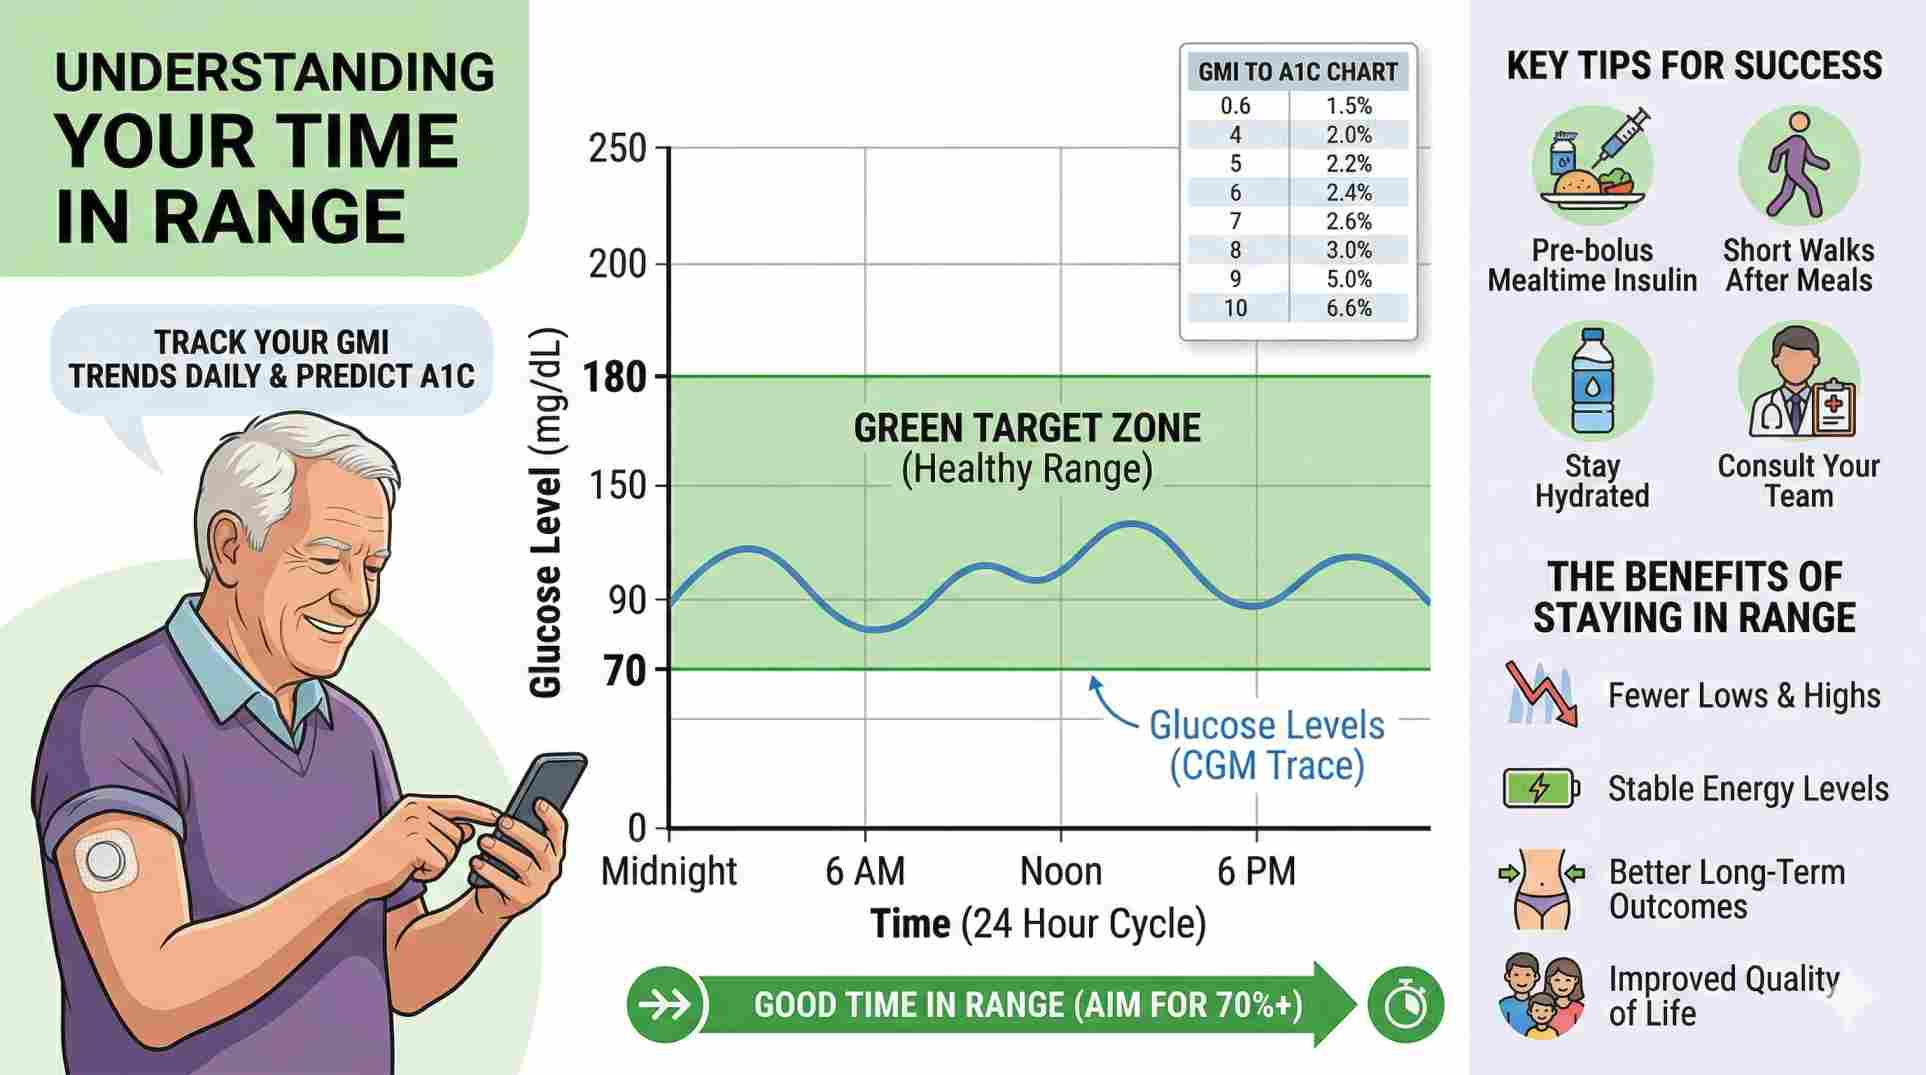
Time in Range vs. The Math
While leaning on a gmi to a1c chart is smart, doctors are increasingly obsessed with a different number: Time in Range (TIR).
Time in Range tracks the exact percentage of your day that your blood sugar sits safely between 70 mg/dL and 180 mg/dL.
Think about it like driving. You could maintain an average speed of 60 miles per hour, which sounds incredibly safe. But if you did that by driving 120 mph for half the trip and 0 mph for the rest, the drive was actually terrifying. The same goes for blood sugar. A smooth, flat line staying in range 70% of the day is vastly healthier than a wild roller coaster that mathematically averages out to a decent GMI.
 Real Ways to Improve Your Daily Numbers
So you know how to read your numbers and you fought the insurance company to get your equipment. What actually improves your daily readings?
- Dose earlier: If you use mealtime insulin, taking it 15 to 20 minutes before taking a bite gives the medication a head start. It hits your bloodstream exactly when the food does, stopping those massive post-dinner spikes.
- Walk for 10 minutes: Simply walking around the block after a heavy, carb-loaded meal forces your muscles to suck up circulating sugar right away. It lowers your daily average without extra drugs.
- Drink more water: Dehydration literally concentrates the sugar in your bloodstream. Drinking water dilutes it. This simple habit genuinely improves your sensor readings.
- Move your sensor: If you stick your CGM on the exact same two-inch patch of stomach every week, scar tissue builds up. That thick tissue blocks the tiny sensor wire from reading the fluid accurately. Shift it around.
Managing this condition is exhausting. Do whatever it takes to stop judging the numbers on the screen. A high number is not a moral failure. It is just raw data. It is a blinking light on a dashboard telling you to drink water, grab a snack, or go for a walk.

Taking Ownership of Your Health Data
Dealing with medical data every day is a heavy lift. You are functioning as a patient, but also as a data analyst. By keeping a gmi to a1c chart saved on your phone or printed on your fridge, you take the terrifying guesswork out of the equation. You look at the app, know exactly what the math means for your actual body, and make calm, informed choices. Trust your equipment, lean on your daily habits, and use your gmi to a1c chart to navigate your health on your own terms.

Hot

Hot

Hot
Hot
What exactly is a gmi diabetes chart?
It is a reference table that takes your continuous glucose monitor’s 14-day or 30-day average reading and translates it into an estimated A1C percentage, helping you predict your lab results.
Does Medicare actually cover continuous glucose monitors?
Yes. Medicare Part B covers them as Durable Medical Equipment if your doctor clearly documents that you use insulin, or if you have a documented history of severe low blood sugars.
Why is my GMI so much higher than my lab A1C?
Red blood cells usually live about 90 to 120 days. If yours live slightly longer than average, or if you have an iron deficiency, your physical lab test will look completely different than the pure math your CGM uses.
Should I look at my gmi to a1c every day?
No. Check the 14-day average maybe once a week. Checking it every single day will just drive you crazy because the math needs time to build a solid average. Look for trends, not single bad days.
Will my insurance stop paying if my numbers are bad?
No. Most insurance companies and Medicare just need proof from your doctor that you are actually wearing the device and trying to manage your health. They do not cut off your prescription just because your blood sugar ran high a few times.


Write a comment
Your email address will not be published. All fields are required